gnuplot [script-filename]Or if you are a beginner, after going into gnuplot (without filename), type
help plotthen you will see some explanations.
	G N U P L O T
	Version 4.2 patchlevel 3
	last modified Mar 2008
	System: Linux 2.6.27-14-generic

	Copyright (C) 1986 - 1993, 1998, 2004, 2007, 2008
	Thomas Williams, Colin Kelley and many others

	Type `help` to access the on-line reference manual.
	The gnuplot FAQ is available from http://www.gnuplot.info/faq/

	Send bug reports and suggestions to <http://sourceforge.net/projects/gnuplot>


Terminal type set to 'x11'
gnuplot> help plot
`plot` is the primary command for drawing plots with `gnuplot`. ...

Syntax:
      plot {}
           { | {"" {datafile-modifiers}}}
           ...
gnuplot> quit
$
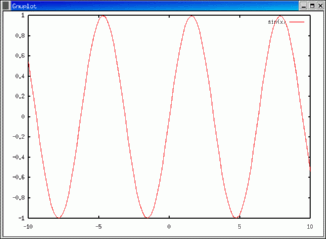
One of the simplest sample is the following.
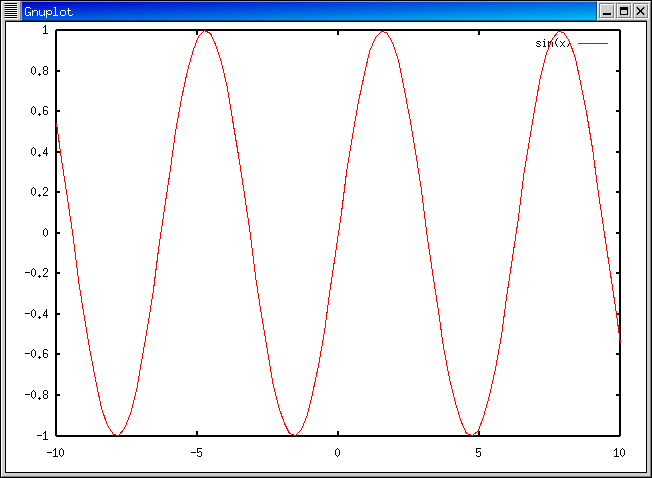
$ gnuplot
G N U P L O T
Version 4.2 patchlevel 3
....
Terminal type set to 'x11'
gnuplot> plot sin(x)
gnuplot> quit
$
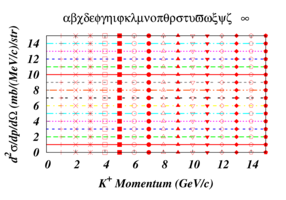
The figure below is a sample output of gnuplot4.2. The horizontal axis is the type of points, and the vertical axis is the type of lines. (They are not K+ momentum etc.!!) The script file is here, and its output EPS file is here.

|
Line and point color is specified by the linetype.
| linetype(lt)-color and lt-dash correspondence in gnuplot 4.2 | ||||||||||
| lt(or lc) | 1 | 2 | 3 | 4 | 5 | 6 | 7 | 8 | 9 | lt(lc)>10 |
| dashed type (lt) | solid | dashed | short dashed | dotted | dot dashed | dot short dashed | ... | dot dot dashed | ... | dash @ mod(lt-1,9)+1 |
| color (lc) | red | green | blue | magenta | lightblue | yellow | black | orange | grey | color @ mod(lc-1,9)+1 |
The script file of color PS output is here, and its PS (eps) output is here.
The above number-color correspondence in gnuplot-4.2 is the same in gnuplot-3.7. But the "linestyle" in 3.7 has to be replaced with "style line".
set linestyle  1 lt 1 lw 6 # in gnuplot 3.7 script
set style line 1 lt 1 lw 6 # in gnuplot 4.x script
[New in 4.2] In gnuplot-4.2, we can specify lt (line type) and lc (line color) separately. Now we can draw red-dashed (lt=2, lc=1) or black-solid (lt=1, lc=7) lines.
set linestyle  1 lt 1 lc 7 # black-solid
set linestyle  2 lt 2 lc 1 # red-dashed
set term postscript
set output "YOUR-OUTPUT-FILE-NAME"
and plot the figure. Then the figure is saved in the PS file which you specified.
| Interactive Session Example | Script Session Example |
$ gnuplot gnuplot> set term postscript gnuplot> set output "YOUR-OUTPUT-FILE-NAME" gnuplot> plot ... gnuplot> quit $ lpr YOUR-OUTPUT-FILE-NAME |
$ gnuplot sin.plt
$ lpr sin.ps
with a test gnuplot script (sin.plt) as, set term postscript eps color enh "Times-BoldItalic" set title "sin(x)" set output "sin.ps" plot sin(x) |
You can put Greek and other character or symbols in postscript. Guide is here (ps) or here (pdf).
-
Example of 3D plot.
 Energy Surface of 12C, taken from
our paper.
By using "splot", we can draw surface and contours.
Energy Surface of 12C, taken from
our paper.
By using "splot", we can draw surface and contours.
-
Example to Draw Contour in 2D plot.
Drawing contour in 2D plot is not a trivial task.... When we try to draw 2D contour by using "set view 0,0" (as in this script), y-axis is drawn in the right axis, and the contour line type cannot be specified, as in the left figure.
Thus I usually do this in two steps. In the first step, I output the contour data in "tables", and in the second step, I plot that data.
# 1st step
set term "table"
set output "temp.dat"
splot ....
# 2nd step
set term post eps enh ....
set output "temp.eps"
plot "temp.dat" using 1:2 with lines
-
Example of Multiplot by using functions
 Impact parameter dependence of the IMFs in 197Au+
197Au collision, taken from
our paper.
In gnuplot3.6beta, we can call functions from data,
e.g., "plot 'datafile' using 1:(f($2))".
This enables us to plot some figures in one plot,
if you are patient.
You can also use "set multiplot", when the figures
are not connected.
Impact parameter dependence of the IMFs in 197Au+
197Au collision, taken from
our paper.
In gnuplot3.6beta, we can call functions from data,
e.g., "plot 'datafile' using 1:(f($2))".
This enables us to plot some figures in one plot,
if you are patient.
You can also use "set multiplot", when the figures
are not connected.
-
Example of Multiplot
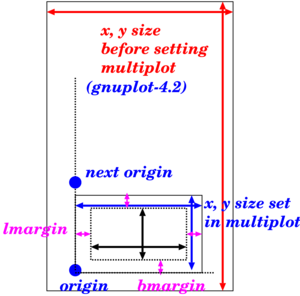
Effective free energy as a function of the chiral condensate is taken from our paper. In recent versions of gnuplot, we can set bmargin (bottom margin), tmargin, lmargin, and rmargin in plot and multiplot. It means that, without any functional transform, drawing axis by hand, or fine tuning of the position of figures in multiplot, we can draw compactly packed figures.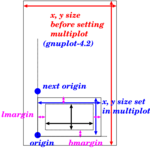

[New (Different) in 4.2]
In gnuplot-4.2, the meaning of the "origin" in multiplot becomes different from those in previous versions. Now we should set "Xmargin=0" (X=b,t,l,r) in order to make neatly packed figures.It is also possible to use "multiplot layout", but I think it is not yet in a satisfactory level.
NX=1; NY=3
DX=0.25; DY=0.25; SX=0.8; SY=0.6
set bmargin 0; set tmargin 0; set lmargin 0; set rmargin 0
set size SX*NX+DX*1.5,SY*NY+DY*1.8
set multiplot
# First  Figure
set size SX,SY
set origin DX,DY      ; plot ....
# Second Figure
set origin DX,DY+SY   ; plot ....
# Third  Figure
set origin DX,DY+SY*2 ; plot ....
unset multiplot
-
Filled Curves (with filledcurves)
[New in 4.2]
One of the convenient extensions in 4.2 is the "filledcurves". We can fill the area surrounded by your curve. You can draw a filled (big) circle in the following way,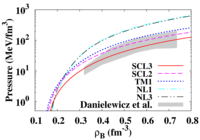
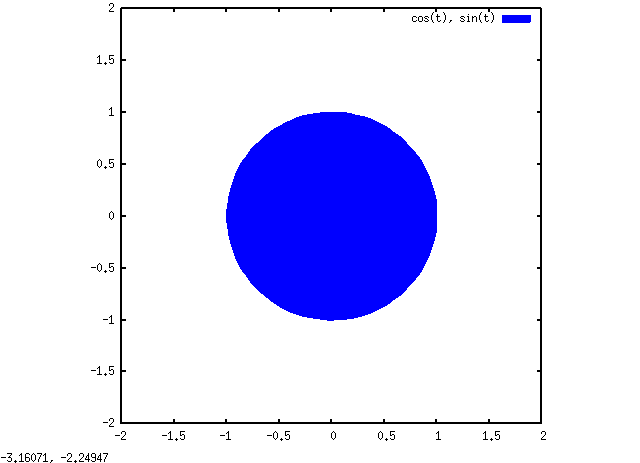
set size ratio 1
set parametric
set tra [0:2*pi]
set xra [-2:2]
set yra [-2:2]
plot cos(t),sin(t) w filledcu lt 3
If you have the data of boundary, you can fill that area with "filledcurves".plot "Data_of_Boundary" u 1:2 w filledcu lc rgb "#CCCCCC"
When you draw the area with "filledcurves", previous lines before are overwritten in that area. It may be a good idea to re-draw the curves twice.plot \ "Data_of_Your_Prediction" u 1:2 title "Theory" w l lt 1\ ,"Data_of_Boundary" u 1:2 title "Experiment" w filledcu lc rgb "#CCCCCC"\ ,"Data_of_Your_Prediction" u 1:2 notitle w l lt 1
The color "#CCCCCC" shows gray. I show the figure of prediced pressures and experimentally suggested area taken from our paper. In this figure, since we want to show the keys of theories before data key, we draw the theoretical lines twice before and after "filledcu" plot.
-
Nuclear Chart
Combining awk and gnuplot, we can make nuclear chart as follows.
-
To be explained ...
Folloing two figures are also drawn with gnuplot. I will explain later (some time ....)
package