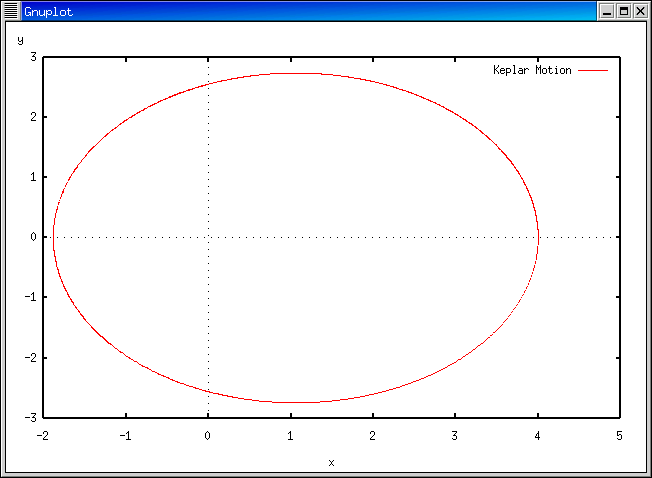
さて、今週作ったプログラムでの 初期条件ではどのような軌道を描くのか、グラフをかいて 調べてみましょう。
赤い文字の部分を打ち込んで下さい。
(コマンド・プロンプトの部分 (ap1 xx: の部分)は login のたびに異なります。)
詳しい説明については gnuplot についての説明のページ を見て下さい。
ap1 xx: f90 prog06.f
f90: compile start : prog06.f
*OFORT90 V01-03-/B 開始
*プログラム名 = PROG06
*プログラム名 = ONESTEP
*プログラム名 = FORCE
*プログラム数 = 0003 , エラーはありません。
ap1 xx: a.out > prog06.dat
ap1 xx: gnuplot
G N U P L O T +
unix version 3.5
patchlevel 3.50.1.17, 27 Aug 93 + 3.1.2, 1 Dec 95
last modified Fri Dec 1 19:13:30 JST 1995 (by Masahito Yamaga)
*** GNUFIT 1.2 22 Nov 93 ***
*** Nonlinear least squares fit added by C. Grammes ***
*** Send bugs regarding fit to cagr@rz.uni-sb.de ***
Copyright(C) 1986 - 1993 Colin Kelley, Thomas Williams
Send bugs and comments to bug-gnuplot@dartmouth.edu
Send bugs, suggestions and mods to bug-gnuplot@dartmouth.edu
Terminal type set to 'x11'
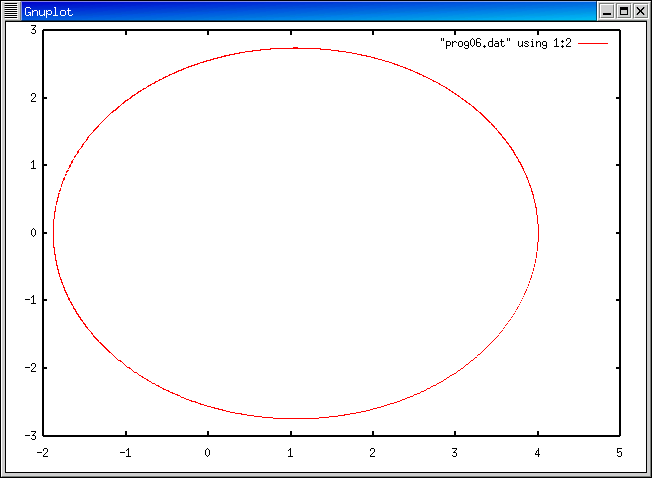
gnuplot> plot "prog06.dat" using 1:2 with lines
(prog06.dat は x, y, t の順序でデータが書かれているので、
x-y のグラフを書くには1桁目と2桁目を使う (using 1:2 の意味)。
また、with lines により、線でグラフを描いている)
gnuplot> quit
ap1 xx: gnuplot prog06.plt