|compphys|
 Gnuplot で描いたグラフを Webpage に載せてみよう (Lesson09-2)
グラフには色々な種類があります。
試してみましょう。
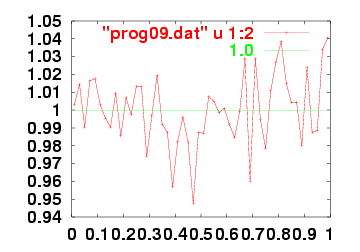
- 標準例: plot "prog09.dat" u 1:2 with linespoints, 1.0
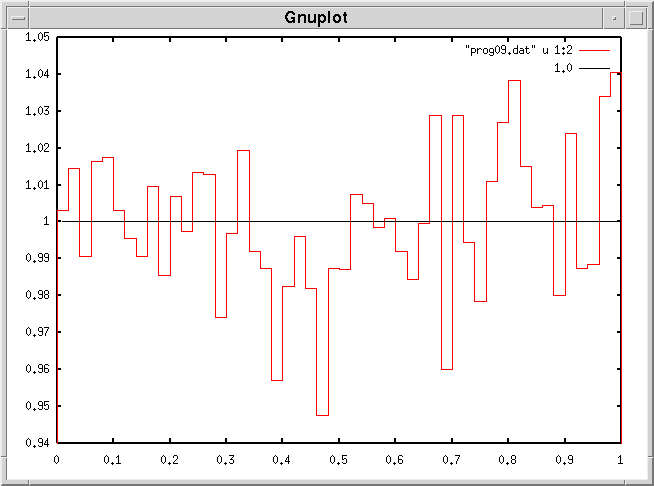
- ヒストグラム: plot "prog09.dat" u 1:2 with histeps, 1.0
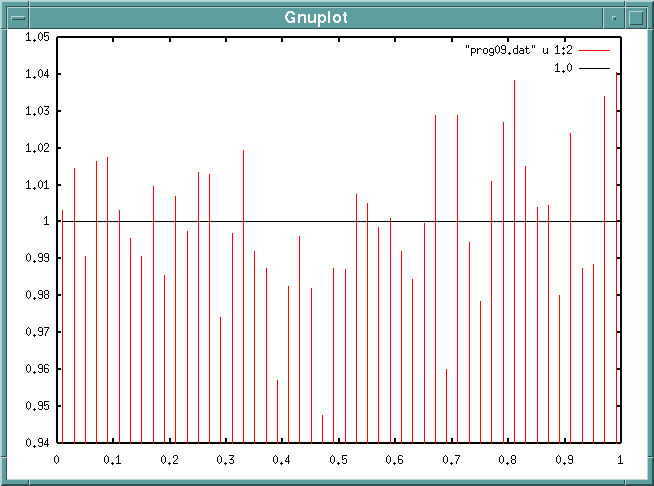
- 縦棒: plot "prog09.dat" u 1:2 with impulses, 1.0
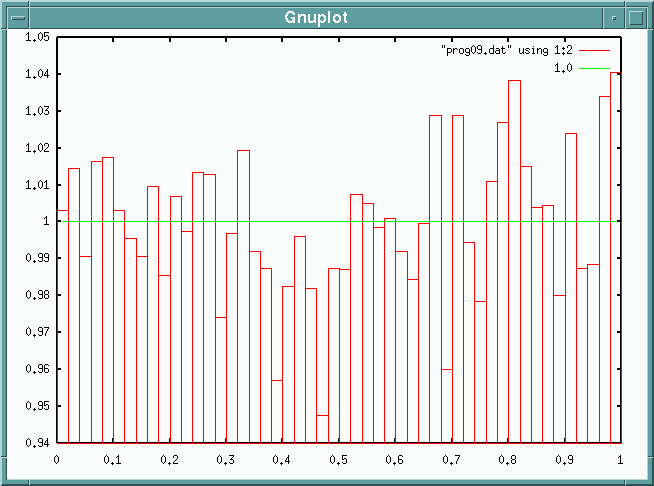
- 箱: plot "prog09.dat" u 1:2 with boxes, 1.0