python:matplotlib:データの読み込み
Table of Contents
概要
研究でmatplotlibを使う場合、実験データや数値計算データなどの外部のファイルに保存されたデータを読み込んでプロットすることが多いと思います。 その方法について簡単な例を元に紹介します。
方法
データの読み込み
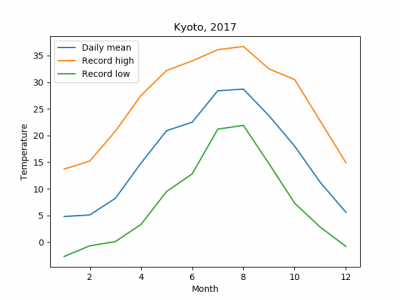
例として2017年の京都の月別平均気温のプロットをしてみましょう。 左から月、平均気温、最高気温、最低気温です。
- kyoto.dat
#month mean high low
 1   4.8  13.7  -2.7
 2   5.1  15.2  -0.7
 3   8.2  20.8   0.1
 4  14.8  27.5   3.3
 5  20.9  32.2   9.5
 6  22.5  34.0  12.8
 7  28.4  36.1  21.2
 8  28.7  36.7  21.9
 9  23.7  32.5  14.7
10  18.0  30.5   7.3
11  11.2  22.7   2.8
12   5.6  14.9  -0.8
プロット
NumPyのgenfromtxtを使ってファイルからデータを読み込みます。 data[:,n]にn+1列目のデータが入ります。
- temp.py
import numpy as np
import matplotlib.pyplot as plt

data = np.genfromtxt("kyoto.dat")

plt.plot(data[:,0], data[:,1], label="Daily mean")
plt.plot(data[:,0], data[:,2], label="Record high")
plt.plot(data[:,0], data[:,3], label="Record low")

plt.title("Kyoto, 2017")
plt.xlabel("Month")
plt.ylabel("Temperature")

plt.legend()

plt.savefig("kyoto.png")
コメント行と区切り文字の変更
デフォルトでは行頭が#だとコメント行だと判断され、スペースをデータの区切りとして扱います。 これを変更することも出来ます。
例えば次のようにデータが用意されているとします。
!month mean high low
 1,   4.8,  13.7,  -2.7
 2,   5.1,  15.2,  -0.7
 3,   8.2,  20.8,   0.1
 4,  14.8,  27.5,   3.3
 5,  20.9,  32.2,   9.5
 6,  22.5,  34.0,  12.8
 7,  28.4,  36.1,  21.2
 8,  28.7,  36.7,  21.9
 9,  23.7,  32.5,  14.7
10,  18.0,  30.5,   7.3
11,  11.2,  22.7,   2.8
12,   5.6,  14.9,  -0.8
コメント行の行頭の文字はcommentで、データの区切り文字はdelimiterで指定します。
data = np.genfromtxt("kyoto.dat", comment="!", delimiter=',')
python/matplotlib/データの読み込み.txt · Last modified: 2021/06/27 22:04 by 127.0.0.1

