Table of Contents
概要
- SrVO3を例に、WIEN2WANNIERの簡単な使い方を説明します。
- 結晶構造は以下のサイトのものを使いました。
Python
プログラムはPython2.7で書かれているので、使っているパソコンのデフォルトが3系の場合は2.7系であることを明示する必要があります。 このページの例ですと、WIEN2kのインストールディレクトリにある write_inwf, checkinwplot_lapw, wplot2xsf の最初の行を次のように変更します。
#!/usr/bin/env python2.7
計算手順
準備
SCF計算
プロジェクト名をSrVO3とします。 事前にSrVO3というディレクトリを作って、その中で作業します。 結晶構造のデータから SrVO3.struct を作ってください。 また、並列化する場合は .machines を作成してください。 以下では並列化ありの例を示します。
結晶構造ファイルができたら、SCF計算を実行してください。
$ init -b -numk 1000 -rkmax 7.5
$ run -ec 0.00001 -cc 0.0001 -p
バンド計算
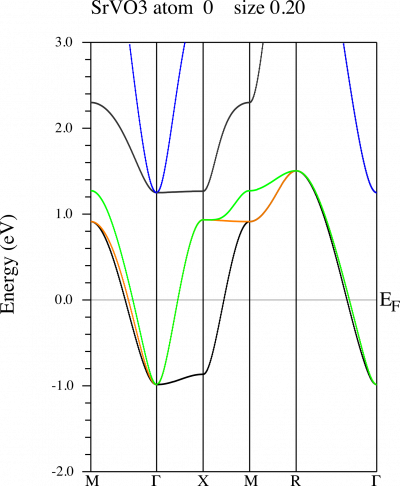
ワニエ軌道として取り出したいバンドを調べるために、バンド構造の計算を行ってください。 できるだけブリルアンゾーン内のいろいろな経路をとるようにします。
- xcrysden を起動し、波数の経路を指定します。ファイル名は SrVO3.klist_band で保存します。
$ xcrysden --wien_kpath SrVO3.struct
- バンド計算を実行します。
$ x lapw1 -band -p
実際にバンドを見るには次のようにします。
$ grep ':FER' SrVO3.scf   # フェルミ準位を確認
$ x spaghetti -p          # SrVO3.inspを生成
$ vim SrVO3.insp          # バンドをプロットするための情報を入力
$ x spaghetti -p
図は SrVO3.spaghetti_ps に出力されます。
WIEN2WANNIER
実際にワニエ関数を作成します。 WIEN2WANNIER用の作業ディレクトリを作成します(subdirの名前は任意です)。
$ prepare_w2wdir subdir
$ cp .machines subdir/.machines
$ cd subdir
初期設定を行います。 init_w2w というスクリプトがあるので、対話形式で進めることができます。
$ init_w2w
next is kgen
>   kgen -fbz	(hh:mm:ss)
           1  symmetry operations without inversion
  NUMBER OF K-POINTS IN WHOLE CELL: (0 allows to specify 3 divisions of G)
300
 length of reciprocal lattice vectors:   0.866   0.866   0.866   6.694   6.694   6.694
  Shift of k-mesh allowed. Do you want to shift: (0=no, 1=shift)
0
         216  k-points generated, ndiv=           6           6           6
KGEN ENDS
0.032u 0.008s 0:05.33 0.5%	0+0k 3352+1320io 14pf+0w
-----> check subdir.klist for generated K-points
-----> continue with findbands or execute kgen again (c/e)?
c
-----> found `subdir.output1' from a previous lapw1 run
-----> enter energy window for findbands [Emin Emax] (eV):
-2 2
>   findbands   -all -2 2	(hh:mm:ss)
0.123u 0.011s 0:00.15 86.6%	0+0k 2176+64io 10pf+0w
# findbands: emin=  -2.000 eV emax=   2.000 eV efermi=  0.6383 Ry
# k-point first last #bands
     1     21    23     3
     2     21    23     3
     3     21    23     3
     4     21    23     3
     5     21    23     3
     6     21    23     3
 . . .
    95     21    25     5
    96     21    25     5
    97     21    25     5
    98     21    25     5
    99     21    25     5
   100     21    25     5

Bloch bands in the interval
at all k:  21    23     3
at any k:  21    25     5
-----> continue with write_inwf or rerun findbands (c/e)
c
>   write_inwf -f subdir 	(hh:mm:ss)
 ++ write_inwf using subdir.struct ++

 Atoms found:
  1  Sr1  Z=38.0  pos= 0.000  0.000  0.000  locrot= 1.000  0.000  0.000
                                                    0.000  1.000  0.000
                                                    0.000  0.000  1.000
  2  V 1  Z=23.0  pos= 0.500  0.500  0.500  locrot= 1.000  0.000  0.000
                                                    0.000  1.000  0.000
                                                    0.000  0.000  1.000
  3  O 1  Z= 8.0  pos= 0.000  0.500  0.500  locrot= 0.000  0.000  1.000
  4               pos= 0.500  0.000  0.500          0.000  1.000  0.000
  5               pos= 0.500  0.500  0.000         -1.000  0.000  0.000

> minimal and maximal band indices [Nmin Nmax]? 21 23
> next proj. (3 to go; Ctrl-D if done)? 2:dxz
added 1 projection: 2:dxz
> next proj. (2 to go; Ctrl-D if done)? 2:dyz
added 1 projection: 2:dyz
> next proj. (1 to go; Ctrl-D if done)? 2:dxy
added 1 projection: 2:dxy

--> 3 bands, 3 initial projections
-----> check subdir.inwf for bands, ljmax and projections
-----> continue or execute write_inwf again (c/e)?
c
>   write_win  	(hh:mm:ss)
-----> check subdir.win for relevant options (disentanglement?)
-----> continue with nnkp or execute write_win again (c/e)?
c
-----> wannier90.x -pp computes kmesh...
>   wannier90 -pp	(hh:mm:ss)
0.554u 0.050s 0:01.22 49.1%	0+0k 28704+472io 86pf+0w
-----> wannier90.x done
- NUMBER OF K-POINTS IN WHOLE CELL … ワニエ化に使うブロッホ関数のk点数を指定してください。最初は少ないk点数から、うまくワニエ化がいかなかったら増やしていきます。
- Shift of k-mesh allowed … k点に対称点を含めるかどうかです。通常は対称点を含むようにしますので 0 を選んでください。
- enter energy window for findbands … さきほど作成したバンド構造を見ながら、ワニエ化するバンドが全て含まれるエネルギーの範囲を指定してください。フェルミエネルギーを基準 (0 eV) とします。
- minimal and maximal band indices … さきほど指定したエネルギーの範囲内に含まれるバンドの指標が表示されるので、その中からワニエ化に使用するバンドの指標を指定します。
- next proj. … ワニエ化する軌道を選びます。V(番号2に対応)のt2g軌道を使用します。同じ原子の軌道であれば 2:dxz,dyz,dxy と一気に指定することも可能です。
- write_win … 自動的にWannier90の入力ファイルが作成されます。通常はそのままで大丈夫ですが、必要に応じて修正します
ワニエ化に使うk点での固有状態を求めます。
$ x_lapw lapw1 -p
WIEN2WANNIERにより、WIEN2kのデータをWannier90が使えるように変換します (並列計算は行いませんが、フラグ-pをつけることで並列計算用に用意された出力ファイルを読み込んでくれます。以下の x_lapw wplot も同様です)。
$ x_lapw w2w -p
Wannier90を使って実際にワニエ化を行います。Wannier90自体は並列化に対応していません。
$ x_lapw wannier90
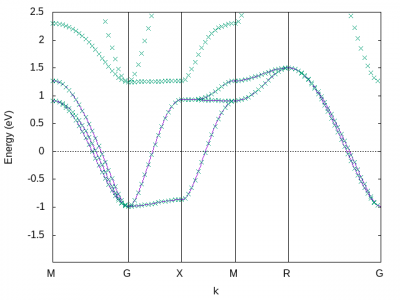
ワニエ化したことで得られたハミルトニアンによるバンドは subdir_band.dat に出力されます。 GNUPLOTを使ってプロットするために subdir_band.gnu が用意されていますので、これをもとにプロットしてみましょう。 図は元の第一原理計算のバンドと重ねてプロットした図です。 実線がワニエ化によって得られたバンドです。
ワニエ軌道のプロット
ワニエ軌道がどのようになっているのかプロットしてみます。
$ x_lapw wplot -p      # 入力ファイルの subdir.inwplot を生成します。
$ vim subdir.inwplot   # 必要に応じて修正します。
subdir.inwplot内の Wannier function index と書かれているところで、何番目のワニエ軌道をプロットするかを指定します。 また、よりきれいなワニエ関数を書きたければ、実空間のグリッドの数を指定する #(grid points) in x, y, z dir. を増やします。
実空間のワニエ関数を計算します。
$ x_lapw wplot -p
wplotで生成したファイルをXCrysDenで読み込める形式に変換します。
$ wplot2xsf
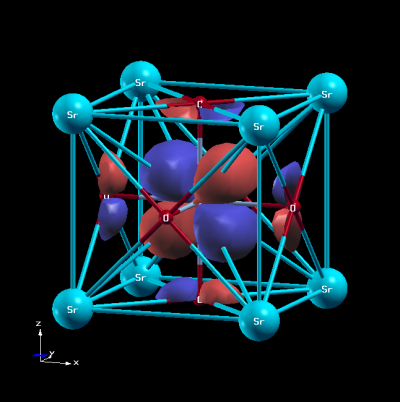
得られたワニエ軌道は次のようにして見ることができます(1番目のワニエ軌道を描くときの例です)。
$ xcrysden --xsf subdir_1.xsf
- [Modify] → [Atomic Radius] → SpaceFill/Ball factor を0.5に設定 → [OK]
- [Tools] → [Data Grid] → [Isosurface] → “Isovalue”を0.01に設定、“Render +/- isovalue”にチェック → [Submit]
赤がワニエ軌道の正の部分、青が負の部分に対応します。 ワニエ化したバンドに酸素の軌道が少し混じっているので、酸素サイトにもワニエ軌道が漏れ出していることがわかります。


