python:matplotlib:線種の設定
Table of Contents
概要
matplotlibのラインやポイントをいろいろ変更します。
基本的な使い方
例えば、赤色の実線で●形のマーカーをつなぎたい場合は
plt.plot(x, y, "-or")
とします。 -orは、左から「実線」「●形のマーカー」「赤色」を意味します。 指定する順番は任意です。
- line.py
import numpy as np
import matplotlib.pyplot as plt

x = np.arange(-5, 5, 0.2)
y = np.sin(x)

plt.plot(x, y, "-or")

plt.savefig("line.png")
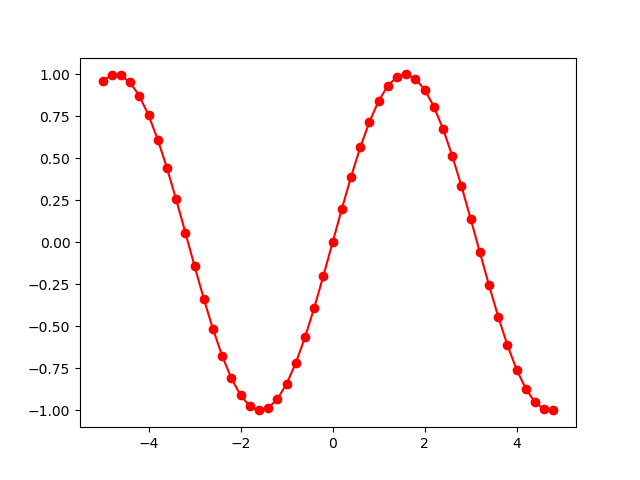
マーカーがいらない場合は、oを消して-rとすれば赤色の実線になります。 またrを消すと色は自動的に設定されます。
ライン、マーカーと色の種類
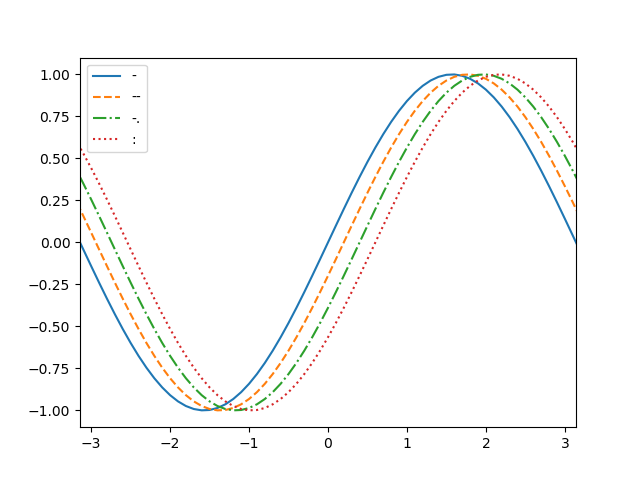
ラインの種類
ラインの種類は次のとおり用意されています。
- lines.py
import numpy as np
import matplotlib.pyplot as plt

x = np.arange(-5, 5, 0.1)
y = np.sin(x)

plt.plot(x,     y, "-",  label="-")
plt.plot(x+0.2, y, "--", label="--")
plt.plot(x+0.4, y, "-.", label="-.")
plt.plot(x+0.6, y, ":",  label=":")

plt.legend()

plt.xlim(-np.pi, np.pi)

plt.savefig("lines.png")
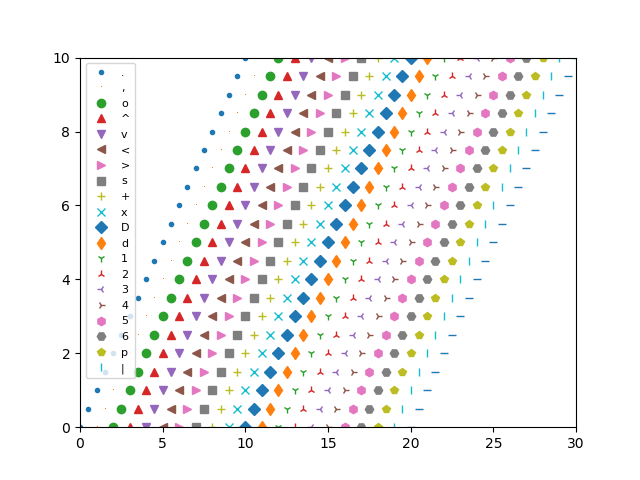
マーカーの種類
マーカーの種類は次のとおり用意されています。
- points.py
import numpy as np
import matplotlib.pyplot as plt

x = np.arange(0, 50, 0.5)

plt.plot(x, x, ".", label=".")
plt.plot(x+1, x, ",", label=",")
plt.plot(x+2, x, "o", label="o")
plt.plot(x+3, x, "^", label="^")
plt.plot(x+4, x, "v", label="v")
plt.plot(x+5, x, "<", label="<")
plt.plot(x+6, x, ">", label=">")
plt.plot(x+7, x, "s", label="s")
plt.plot(x+8, x, "+", label="+")
plt.plot(x+9, x, "x", label="x")
plt.plot(x+10, x, "D", label="D")
plt.plot(x+11, x, "d", label="d")
plt.plot(x+12, x, "1", label="1")
plt.plot(x+13, x, "2", label="2")
plt.plot(x+14, x, "3", label="3")
plt.plot(x+15, x, "4", label="4")
plt.plot(x+16, x, "h", label="5")
plt.plot(x+17, x, "H", label="6")
plt.plot(x+18, x, "p", label="p")
plt.plot(x+19, x, "|", label="|")
plt.plot(x+20, x, "_", label="_")

plt.legend(fontsize=8)

plt.xlim(0, 30)
plt.ylim(0, 10)

plt.savefig("points.png")
色の種類
| b | 青 (Blue) |
| g | 緑 (Green) |
| r | 赤 (Red) |
| c | シアン (Cyan) |
| m | マゼンタ (Magenta) |
| y | 黄 (Yellow) |
| k | 黒 (Black) |
| w | 白 (White) |
ラインの太さ
線の太さはlinewidthあるいはlwで指定します。
plt.plot(x, y, "-", linewidth=2)
マーカーの大きさ
マーカーの大きさはmarkersizeあるいはmsで指定します。
plt.plot(x, y, "o", markersize=8)
色
色を細かく指定する場合はcolorあるいはcで指定します。
色の名称による指定
plt.plot(x, y, color="red")
使用できる色の名前は以下のページで参照してください。
16進数のカラーコードによる指定
plt.plot(x, y, color="#ff0000")
RGBによる指定
3成分の配列に赤、緑、青の重みを指定します。
plt.plot(x, y, color=[1.0, 0.0, 0.0])
グレースケールによる指定
0(白)から1(黒)までで指定します。
plt.plot(x, y, color=0.5)
参考
python/matplotlib/線種の設定.txt · Last modified: 2021/06/27 22:04 by 127.0.0.1